Welcome to
Fenwick Island Real Estate & Luxury Homes Guide
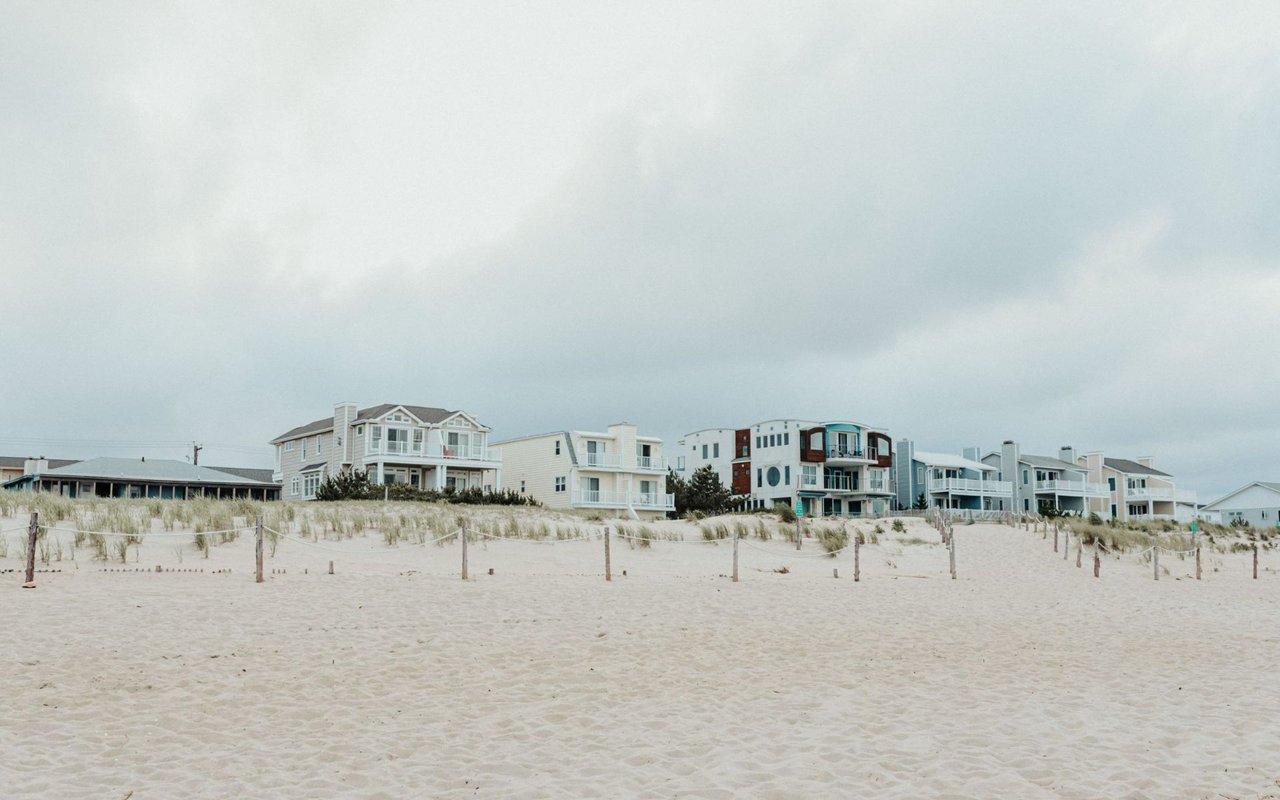
Escape to the Quiet Resort!
Fenwick Island is where luxury meets simplicity. Positioned on the Delaware-Maryland line, this exclusive enclave offers the financial benefits of Delaware's low taxes alongside the serene beauty of uncrowded beaches and private bay access. From prestigious oceanfront estates in Fenwick Acres to the quiet canals of King’s Grant, discover why Fenwick Island is the preferred destination for discerning coastal buyers in 2026.